결정트리(Decision Tree)는 데이터 분석과 기계 학습에서 널리 사용되는 지도 학습 알고리즘입니다. 주로 분류와 회귀 문제를 해결하는 데 사용되며, 해석의 용의성, 비선형 관계처리, 적은 데이터 전처리라는 장점을 니다. 특히, 의료 진단(환자의 증상과 검사 결과를 기반으로 질병을 진단), 금융(고객의 신용 점수를 예측하거나 사기 거래를 탐지), 마케팅(고객 세분화 및 타겟 마케팅 캠페인을 최적화)에서 널리 사용되고 있습니다. 따라서 이 글에서는 나이브 베이즈 분류기의 원리와 코드에 대해 자세히 알아보겠습니다.
결정트리란?
결정트리는 데이터의 특성과 목표 변수를 기반으로 의사결정 규칙을 학습하여 트리 형태의 모델을 생성합니다. 각 분기점(node)은 특정 특성(feature)에 대한 조건을 나타내며, 이 조건을 기준으로 데이터를 하위 노드로 분할합니다. 최종적으로 리프 노드(leaf node)는 분류된 결과나 예측 값을 나타냅니다.
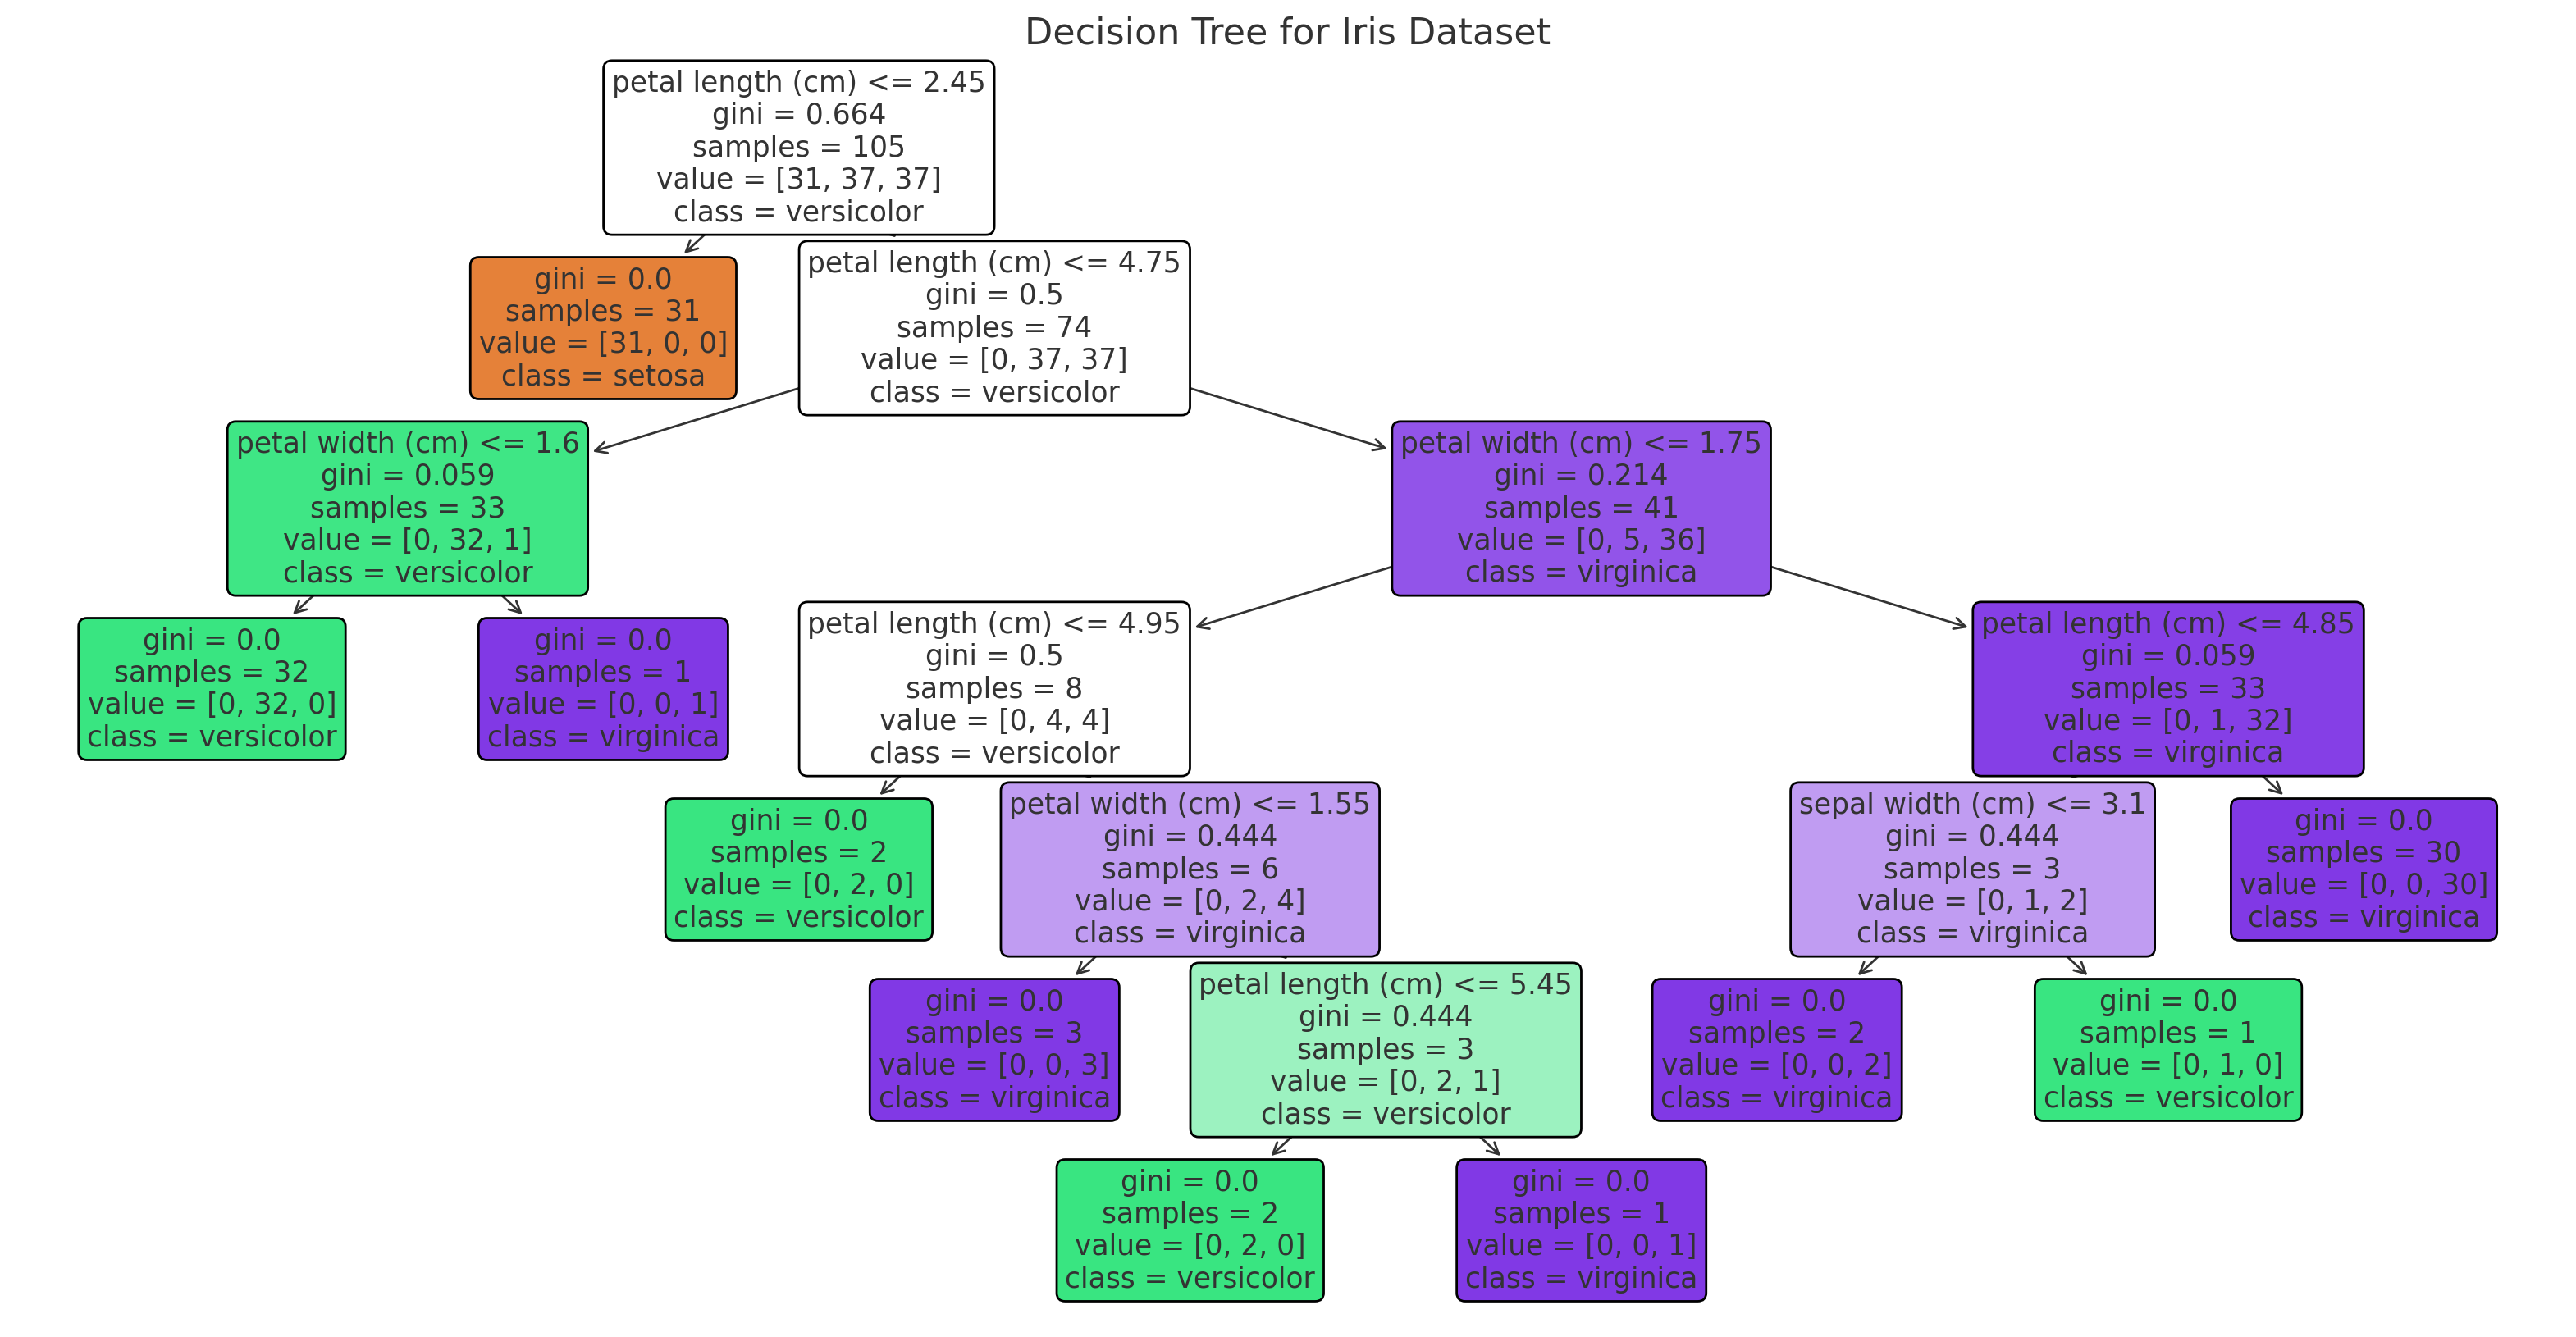
위 그림은 Iris 데이터셋을 사용하여 학습된 결정트리를 나타냅니다. 각 분기점(node)은 특정 특성(feature)에 대한 조건을 기반으로 데이터를 분할하며, 최종 리프 노드(leaf node)는 분류된 결과를 나타냅니다. 색상은 클래스(종류)를 나타내며, 각 노드는 데이터의 분포와 결정 규칙을 시각적으로 보여줍니다.
결정트리의 주요 개념
- 루트 노드 (Root Node): 트리의 최상단에 위치하며, 전체 데이터를 포함합니다. 첫 번째 분할이 이루어지는 지점입니다.
- 내부 노드 (Internal Node): 루트 노드에서 분할된 후의 중간 노드들로, 각 노드는 하나의 특성에 대한 조건을 포함합니다.
- 리프 노드 (Leaf Node): 최종적으로 더 이상 분할되지 않는 노드로, 여기서 최종 분류 또는 예측이 이루어집니다.
- 분할 (Splitting): 노드를 더 작은 하위 노드로 나누는 과정입니다. 이 때 각 분할은 특성의 조건에 따라 이루어집니다.
- 가지치기 (Pruning): 트리의 복잡도를 줄이기 위해 불필요한 노드를 제거하는 과정입니다. 과적합(overfitting)을 방지하기 위해 사용됩니다.
결정트리 예제 코드
- 데이터 불러오기 및 데이터셋 분할하기(아이리스 데이터셋)
import numpy as np
import pandas as pd
from sklearn.model_selection import train_test_split
from sklearn.datasets import load_iris

dataset = load_iris(   )

y = df['target']
x = df.drop('target', axis=1)
x_train, x_test, y_train, y_test = train_test_split(x, y, test_size=0.33, random_state=42)

x_train.shape, x_test.shape, y_train.shape, y_test.shape- Decision Tree Classifier
dt_scores = []
feature_importances = []
n_max_features = range(1, len(x.columns)+1 )
for i in n_max_features:
    dt_classifier = DecisionTreeClassifier(max_features= i, random_state=0 )
    dt_classifier.fit(x_train, y_train)
    dt_scores.append(dt_classifier.score( x_test, y_test  ))

    feature_importances.append(dt_classifier.feature_importances_    )

fi_df = pd.DataFrame(np.array(feature_importances)  , index= x_train.columns,
                     columns =n_max_features)
print( f'feature importances: \n{fi_df}')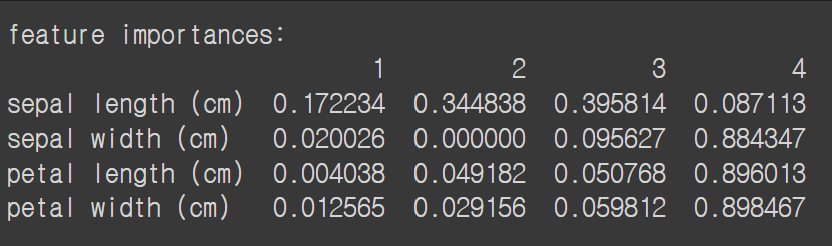
colors = rainbow(np.linspace(0, 1, len(n_max_features))   )
plt.bar(n_max_features, dt_scores, color = colors)

for i in n_max_features:
    plt.text(i, dt_scores[i-1], dt_scores[i-1])
plt.xticks(n_max_features)
plt.xlabel('Max features')
plt.ylabel('Scores')
plt.title('Decision Tree Classifier scores for different number of maximum features')
plt.show()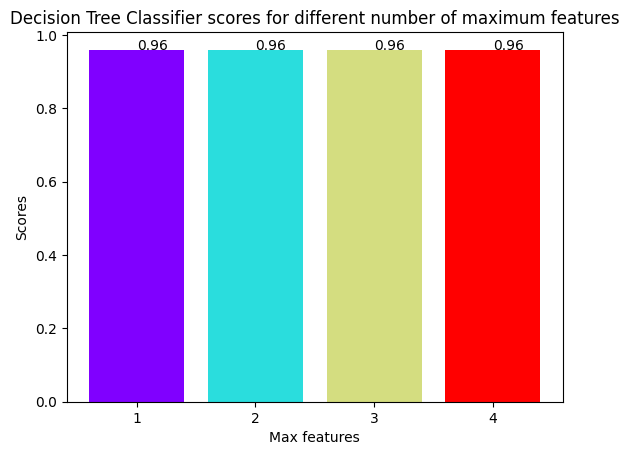
max_idx = np.argmax(dt_scores)
print("The score for Decision Tree Classifier is {}% with {} maximum features.".format(\
                                                            dt_scores[max_idx]*100,max_idx+1))
from sklearn import tree
dt_classifier = DecisionTreeClassifier( max_features = 3, random_state=0 )
dt_classifier.fit( x_train, y_train )
tree.plot_tree(dt_classifier)
plt.show()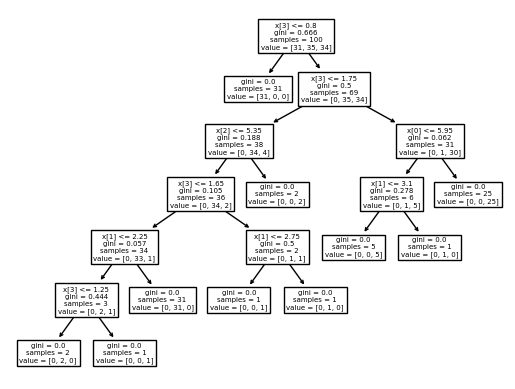
'인공지능&머신러닝' 카테고리의 다른 글
| [머신러닝]서포트벡터머신(SVM,Support Vector Machine)원리 및 코드 예시 (0) | 2024.06.24 |
|---|---|
| [머신러닝]K-최근접 이웃(KNN모델)원리 및 코드 예시 (0) | 2024.06.24 |
| [데이터 전처리]데이터 스케일링(Data Scaling): (0) | 2024.06.24 |
| [머신러닝]나이브 베이즈(Naive Bayes)원리와 코드 예시 (0) | 2024.06.24 |
| 혼동행렬(Confusion matrix) / 정확도 / 정밀도 / 재현율 / F1-score (0) | 2024.06.10 |